1) Park Utilization Factors
Environment Factors
Interested in investigating the factors that affect park utilization, the various environmental and surveyed park utilization data were hence examined for correlation. Environmental data was analysed by aggregating the secondary and tertiary sensor data. Using Kernel Density to interpolate environmental as well as survey data points, correlation between the data-sets was tested using Raster Calculator (to vary weights to the various environmental data and to invert environmental raster values), followed by Band Collection Statistics. However, no significant correlation was found.
Interested in investigating the factors that affect park utilization, the various environmental and surveyed park utilization data were hence examined for correlation. Environmental data was analysed by aggregating the secondary and tertiary sensor data. Using Kernel Density to interpolate environmental as well as survey data points, correlation between the data-sets was tested using Raster Calculator (to vary weights to the various environmental data and to invert environmental raster values), followed by Band Collection Statistics. However, no significant correlation was found.
Park Amenities
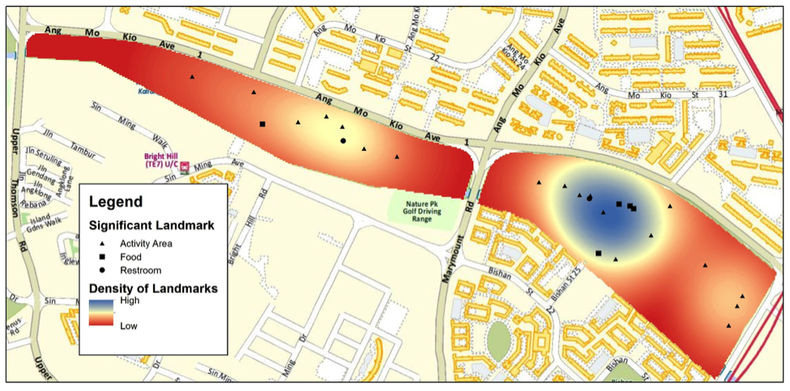
Correlation between park utilization and amenities was explored. Interestingly, park utilization over the three time intervals was found to not be correlated to all facilities (displayed in NParks' maps) but instead correlated (coefficient of 0.7) to the specific facilities of food outlets, restrooms and activity areas such as dog run, event areas, ponds.
Correlation between park utilization and amenities was explored. Interestingly, park utilization over the three time intervals was found to not be correlated to all facilities (displayed in NParks' maps) but instead correlated (coefficient of 0.7) to the specific facilities of food outlets, restrooms and activity areas such as dog run, event areas, ponds.
Walking Tracks
The relationship between park utilization and hangout distance from walking path was investigated using multiple ring buffers (euclidean distance). This was a multi step process, as seen in the model below.
The relationship between park utilization and hangout distance from walking path was investigated using multiple ring buffers (euclidean distance). This was a multi step process, as seen in the model below.
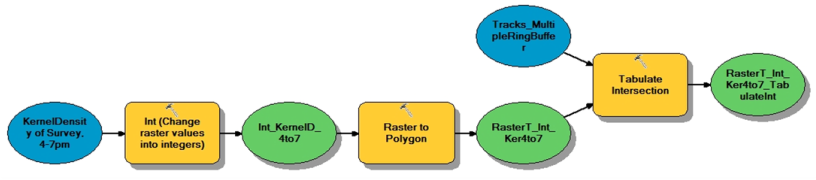
Through tabulating the intersection between the resulting park utilization and multiple ring buffer polygons, it was discovered that from 10am to 4pm, more than half of the people hanging out in the park chose to locate themselves within 10m of the walking path. Between 4pm to 7pm, however, slightly more people chose locations more than 25m from the walking track. This result demonstrates the importance of accessibility as a factor implicating choice of location, especially between the hotter hours of 10am to 4pm.
2) Finding the Best Spots
In recommending best spots to hangout, we sought to evaluate the park based on several factors including temperature, humidity, shade, as well as accessible areas (given the above finding on the importance of accessibility).
Environment Factors
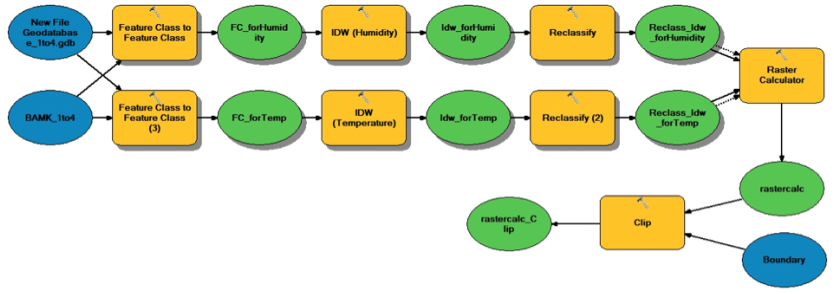
While we were unable to find correlation between environmental factors and surveyed weekend hangout locations, we believe that knowledge on temperature and humidity would aid park visitors in making informed decisions as to where to hangout. We thus isolated areas of low temperature and humidity. Kernel Density was used to interpolate data points based on the various time intervals, and reclassifying the resultant rasters, with areas of the lowest temperature and humidity (bottom 30% of reclassed areas) selected for our consideration of ‘best spots’ in the park.
While we were unable to find correlation between environmental factors and surveyed weekend hangout locations, we believe that knowledge on temperature and humidity would aid park visitors in making informed decisions as to where to hangout. We thus isolated areas of low temperature and humidity. Kernel Density was used to interpolate data points based on the various time intervals, and reclassifying the resultant rasters, with areas of the lowest temperature and humidity (bottom 30% of reclassed areas) selected for our consideration of ‘best spots’ in the park.
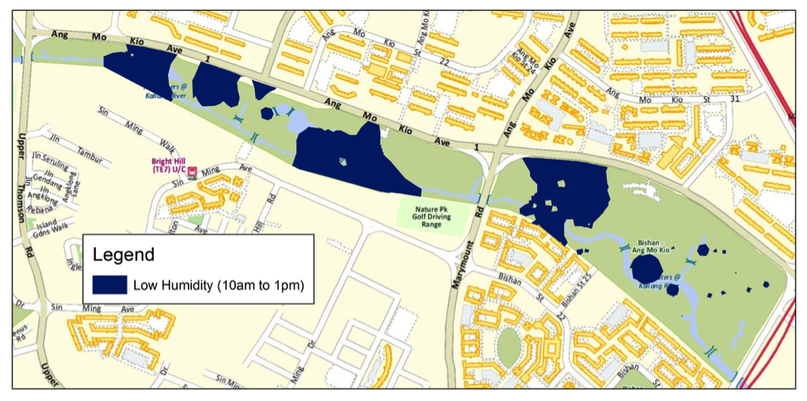
Accessibility
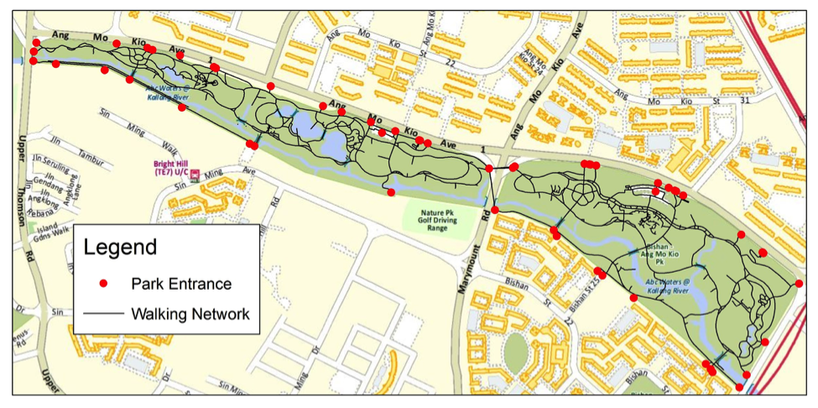
In order to incorporate accessibility as a factor, a walking network of BAMK park was constructed using Network Analyst, based on the park walking tracks. Using service area analysis, areas within 300m (approx 3 to 5 mins walking time) of park access points was selected for best hangout spot consideration.
In order to incorporate accessibility as a factor, a walking network of BAMK park was constructed using Network Analyst, based on the park walking tracks. Using service area analysis, areas within 300m (approx 3 to 5 mins walking time) of park access points was selected for best hangout spot consideration.
Shade
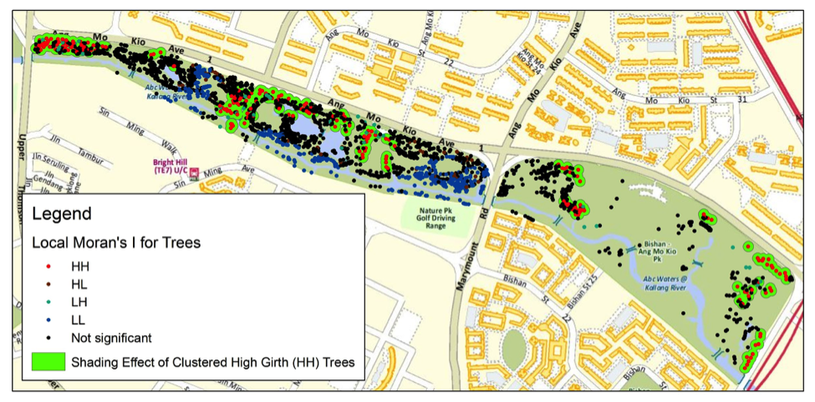
Taking into account shade and cooling effects, tree girth was used as a substitute for the sensor light data. Sensor light data was discovered to be problematic, as secondary and tertiary institutes yielded starkly different light values. Also, using solely secondary or tertiary institute data would have been spatially insufficient for interpolation. While shading effects in the park (inclusive of tree and building shade) could have been computed using 3D modelling, we opted to focus on trees due to trees’ dual capacity to shade and cool, lack of data on buildings, as well as time considerations. Thus, tree girth data was used, with the assumption that larger tree girth better facilitates shade and cooling effects.
Here, shade is important in this analysis as it was observed during surveys that most people tend to hangout in shaded areas. To determine clusters of trees with large girth, Anselin Local Moran’s I was used. Trees points belonging to these clusters were then given a fixed 18m buffer radius, based on Simpson’s (2002) research on tree shade. While this method does not account for sun direction (which affects the amount and location of shade), intersecting this tree buffer with temporal temperature data (temperature is also a function of shading) may minimize error.
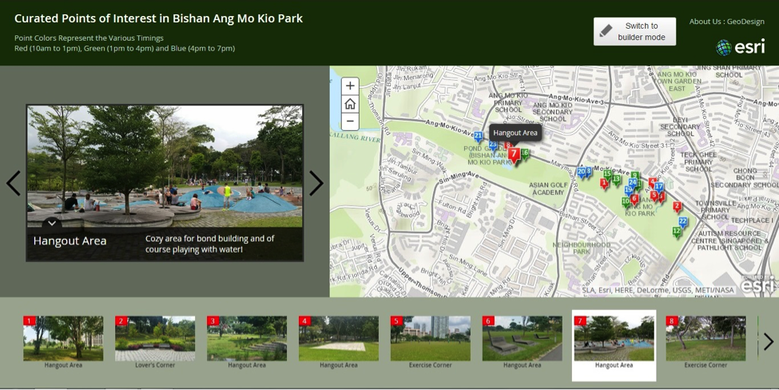
Finally, to visualize recommended hangout areas, the layers based on the various abovementioned factors were intersected, yielding polygon areas (based on the various time intervals). Ground visits of these areas were made, and photos of these areas are featured on StoryMaps.
3) Designing Better Parks
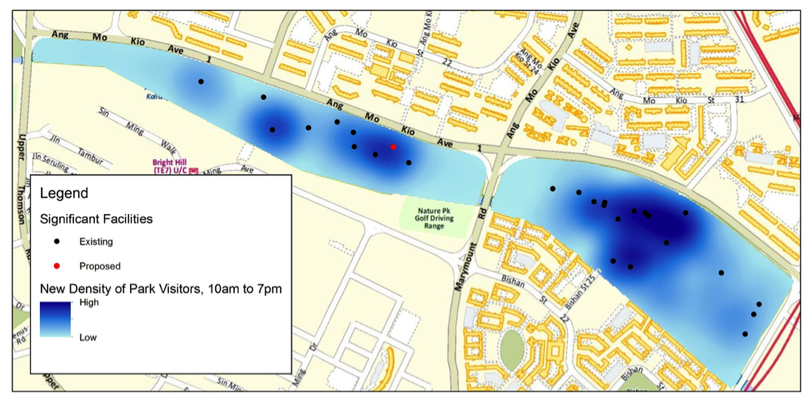
In analyzing our survey data of where park visitors hangout, interpolation of hangout points led to the realization that park utilization is uneven, with the Western half of the park being of lower population density (ie much emptier) than the Eastern half across all surveyed time intervals:
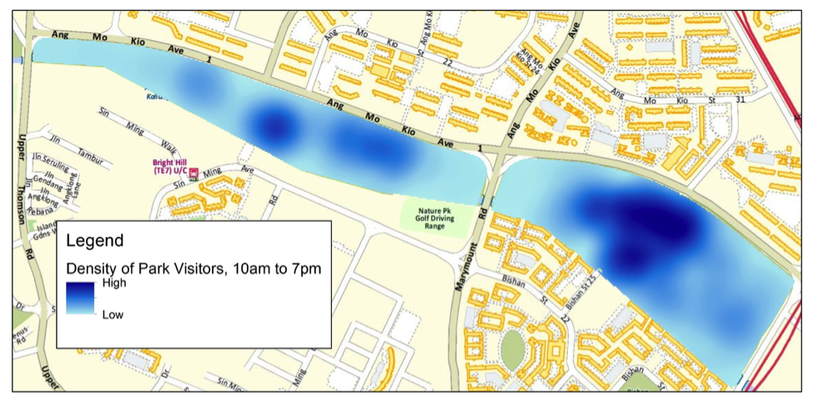
As park utilization location is correlated to the certain facilities (restaurants, restrooms and activity areas, mentioned above), we propose the addition of a new facility in the Western half of the park. Specifically, we propose the addition of a new restaurant or food outlet as the existing food outlets have been observed to be successful (based on hangout data), and food outlets have been observed to have the capacity to attract a large number of park visitors across the various time intervals.
Recognizing the need to consider accessibility, we propose that the facility be located within walking distance of car parks (below 100m, based on proximity of existing food outlets) and other access points (eg. bus stops). The proposed facility location is also chosen based on proximity to walking tracks (10m, based on above mentioned correlation between walking tracks and hangout locations). A recce of the proposed site was conducted to examine the viability of the place (to view terrain, and other existing structures that may not be represented in the BAMK shapefiles).
Finally, anticipated density of park visitors was simulated using our initial survey data. This was done by assuming that the new food facility would attract similar visitor distributions and numbers to the existing food outlets. Kernel density rasters, as well as raw data points of hangout locations upon the addition of this proposed facility can be visualized on Operation Dashboard to facilitate park planners’ visualization of BAMK for the improvement of park utilization in the Western part of BAMK.